
Australia's 20 best and 20 worst performing salaries
Shaped by local and global forces, some roles have rocketed in value while others tumbled. As we approach 2020, SEEK’s Senior Employment Trends Analyst, Leigh Broderick looks back at the 20 best and 20 worst performing salaries and shares his insights into where Australian salaries may head in the next decade.
Three trends driving the top performers
Super smashes its way to number one

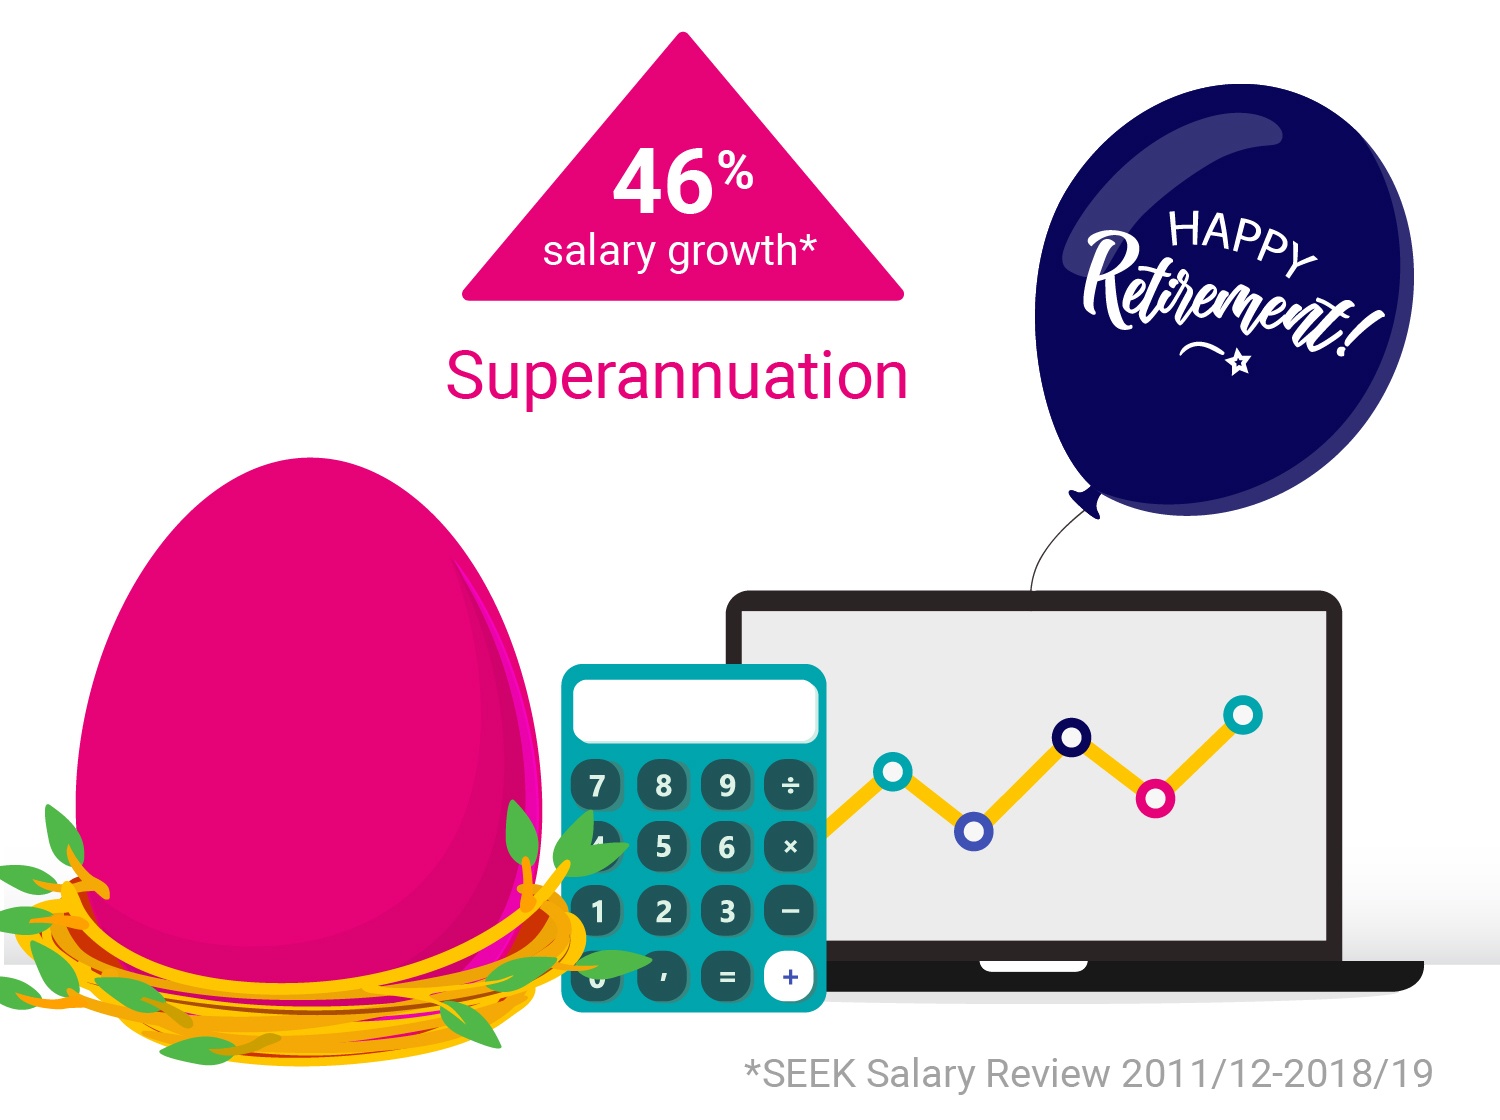
The gold medal goes to roles in the Superannuation industry, which had the highest recorded salary rise of 46%. The industry has undergone rapid expansion – according to the Association of Superannuation Funds of Australia, superannuation assets in Australia had grown to $2.8 trillion by the end of the March 2019 quarter. Interestingly, however, there hasn’t been corresponding growth in the number of available roles, suggesting the increase in salaries we’re seeing in the SEEK data has been driven by the demand for specialised roles in the industry.
Rise of a caring nation
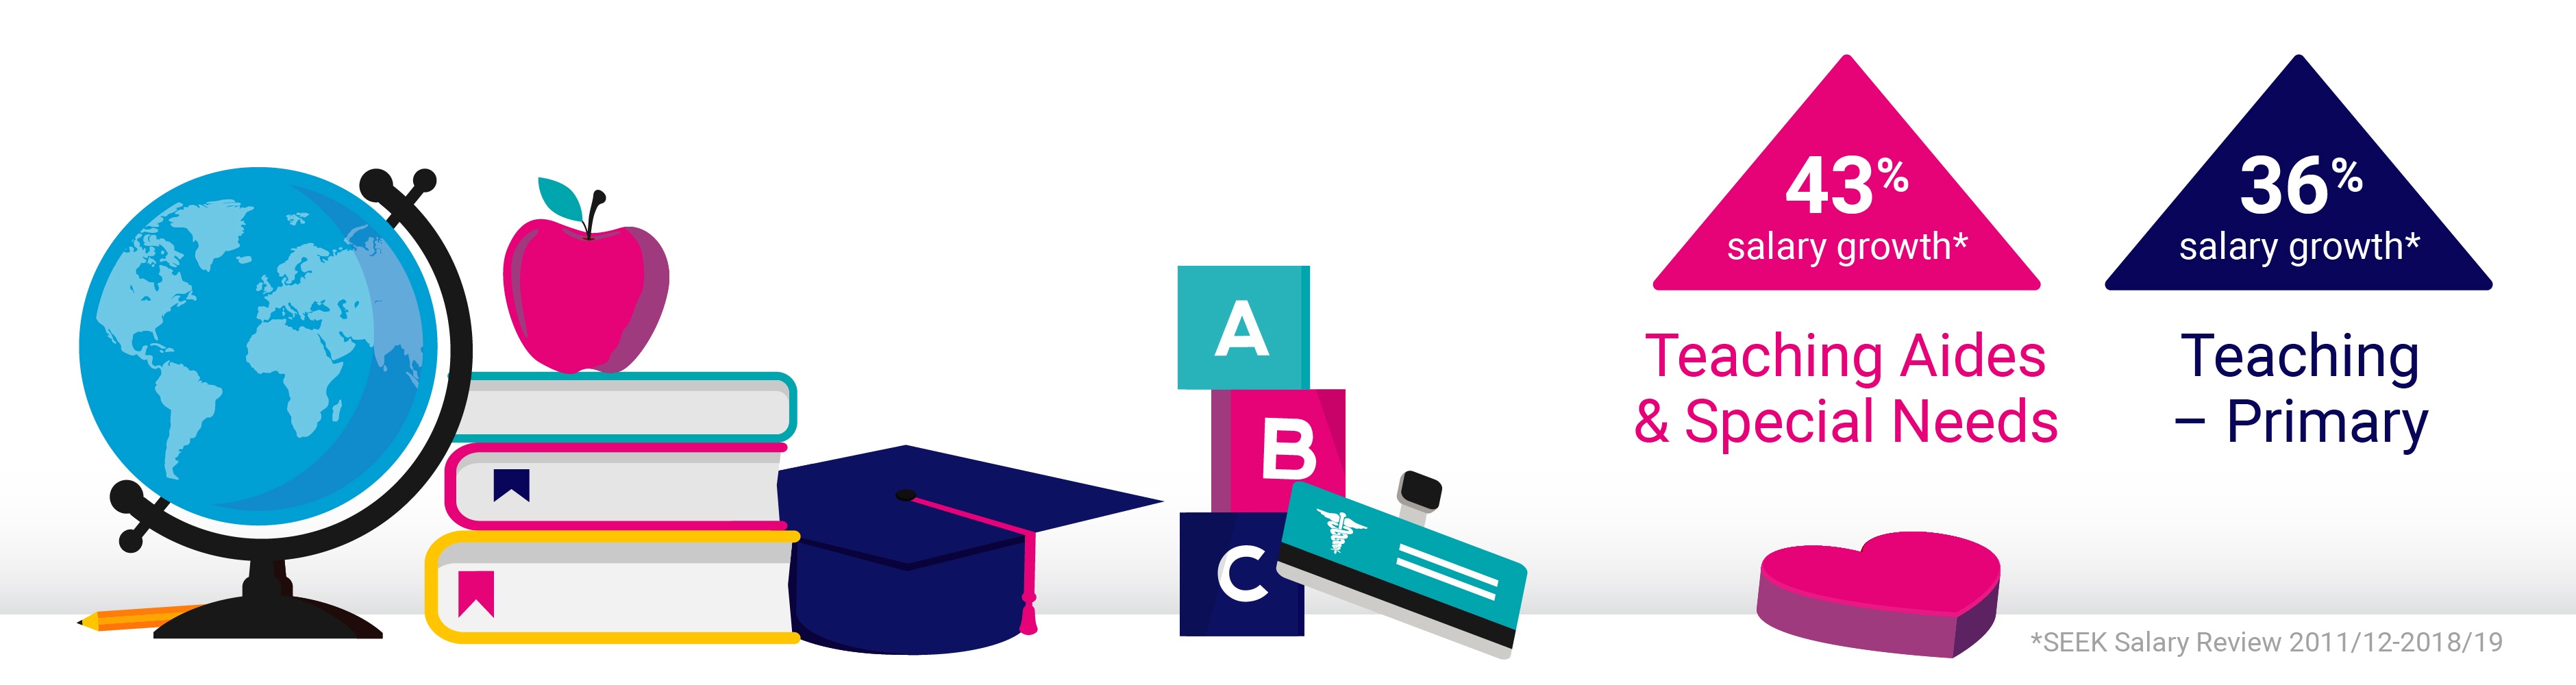
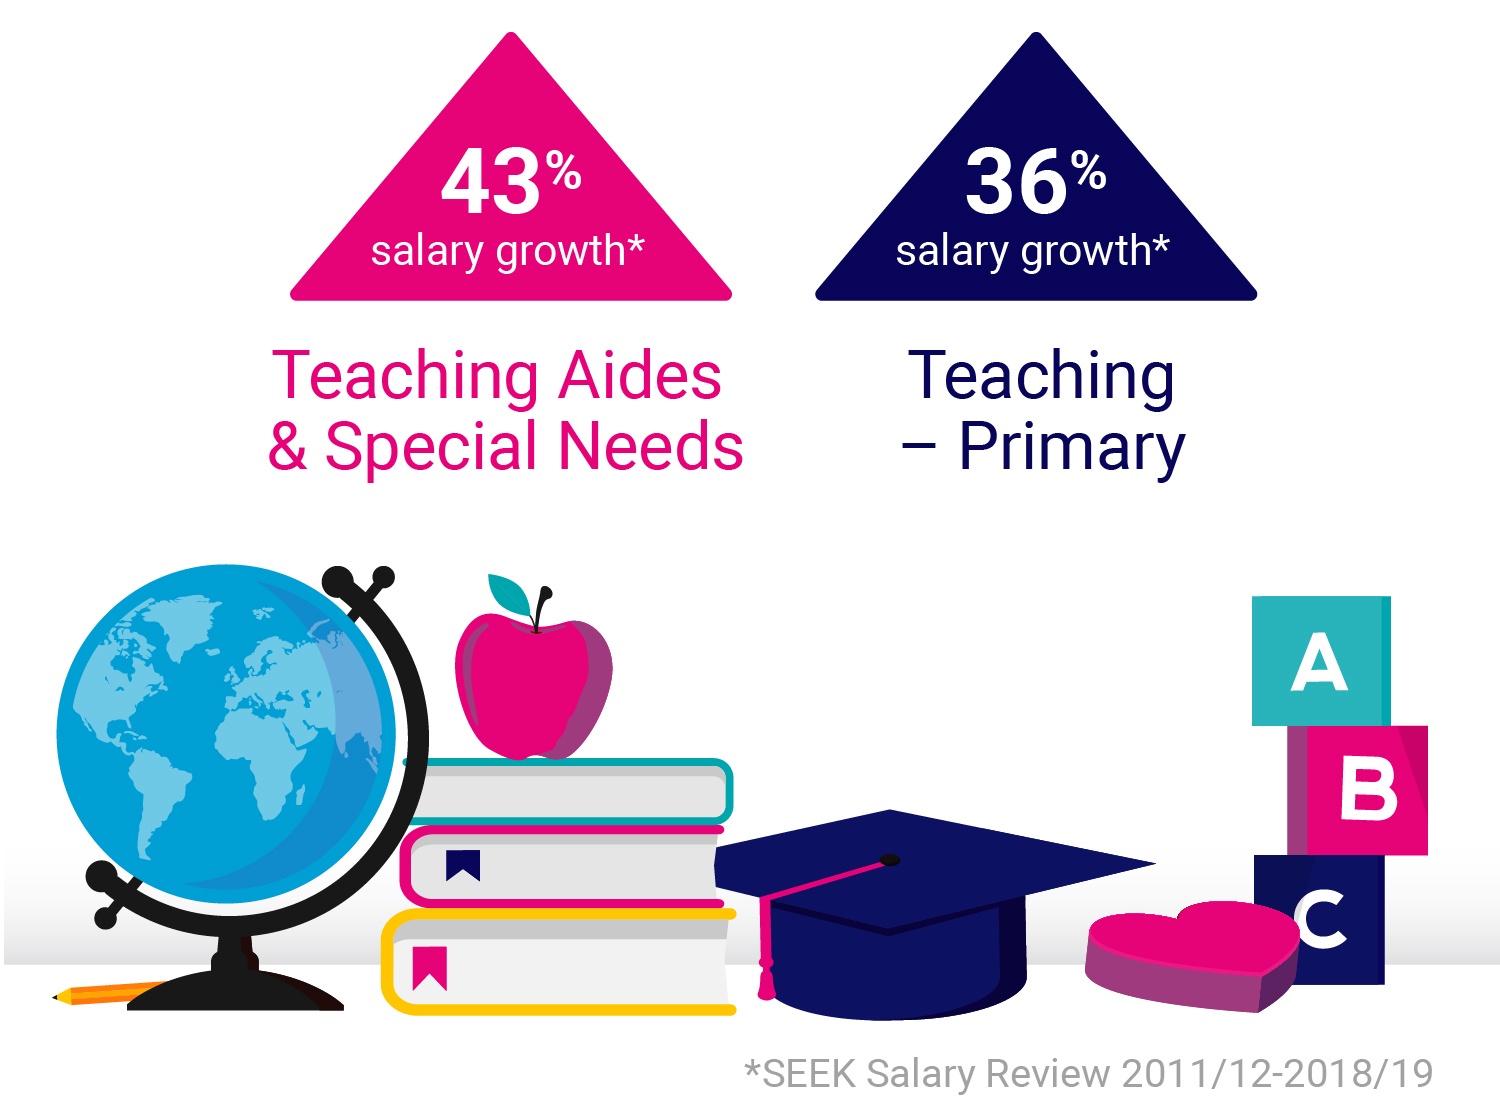
No less than eight of the 20 fastest risers were in health and education. These included teachers and carers in every age group from preschool to secondary school and people working in aged care, disability support, child welfare and youth and family services. This suggests recognition for those traditionally at the lower end of the scale. As the population grows and ages and initiatives like the National Disability Insurance Scheme (NDIS) are introduced, demand for skilled professionals in Healthcare and Education has seen consistent year-on-year growth in Australia. According to the Federal Government, spending on health grew by about 50% in real terms to $16 billion over the decade to 2015-16 and, today, Healthcare and Education combined are Australia’s largest employers by far.
STEM burns bright
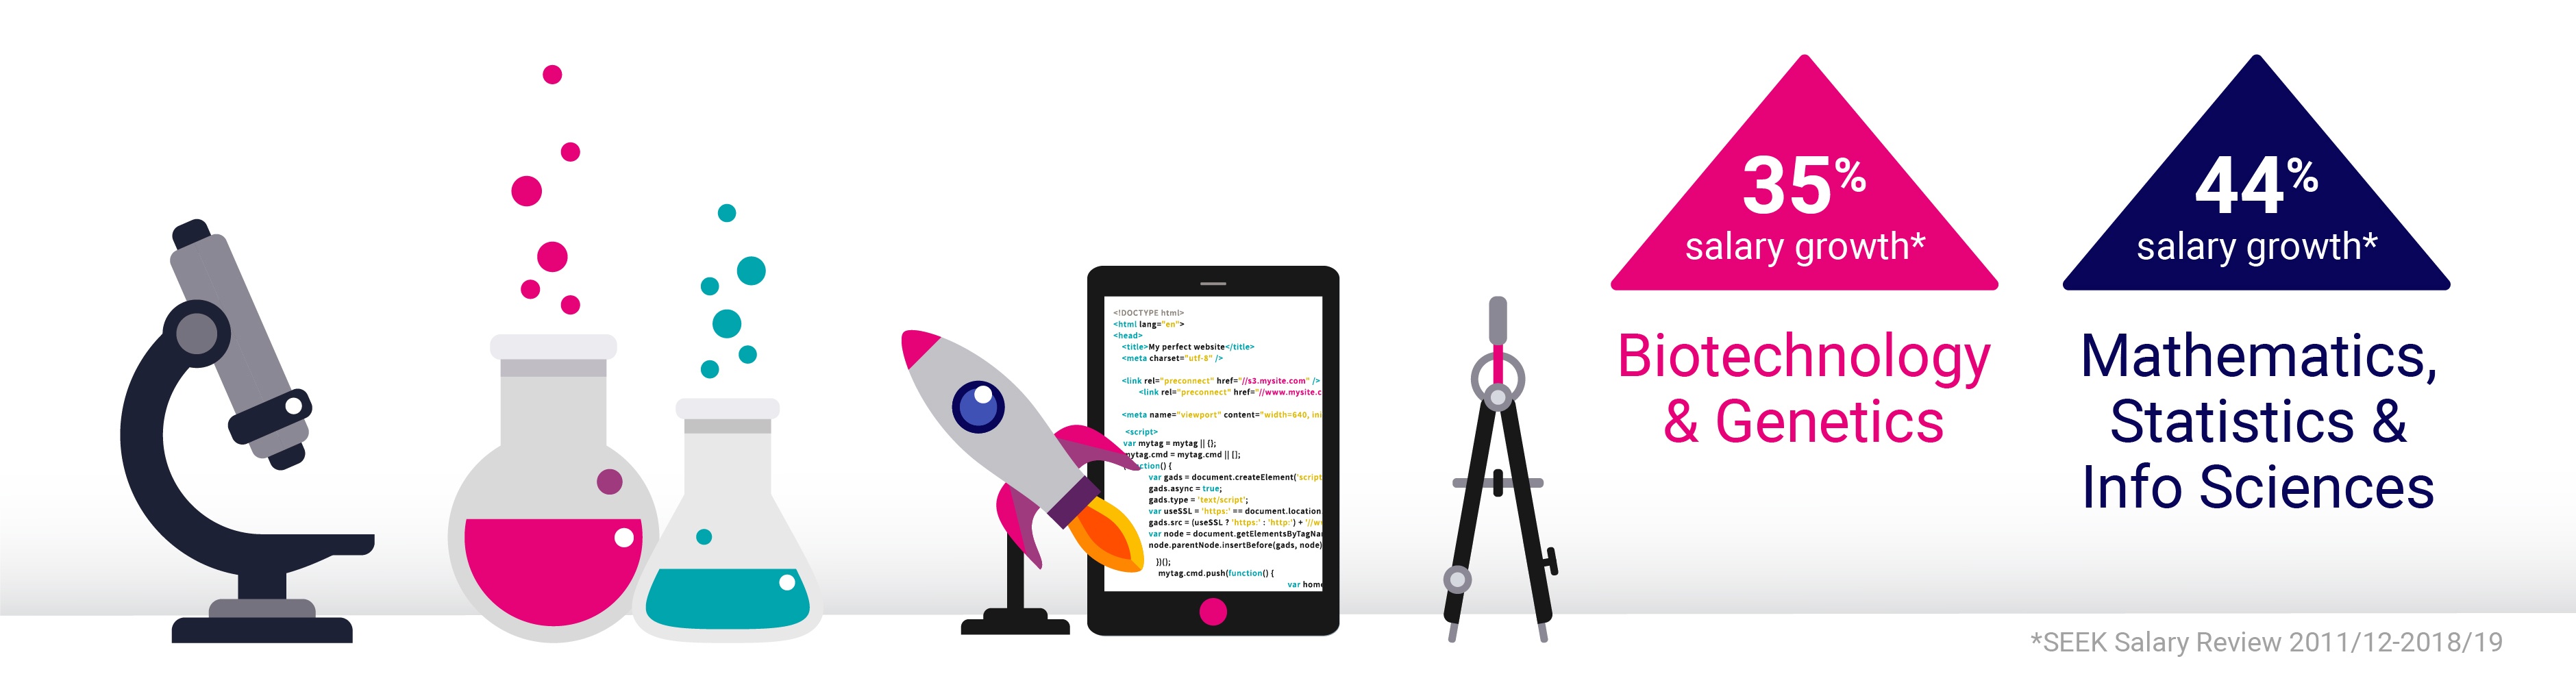
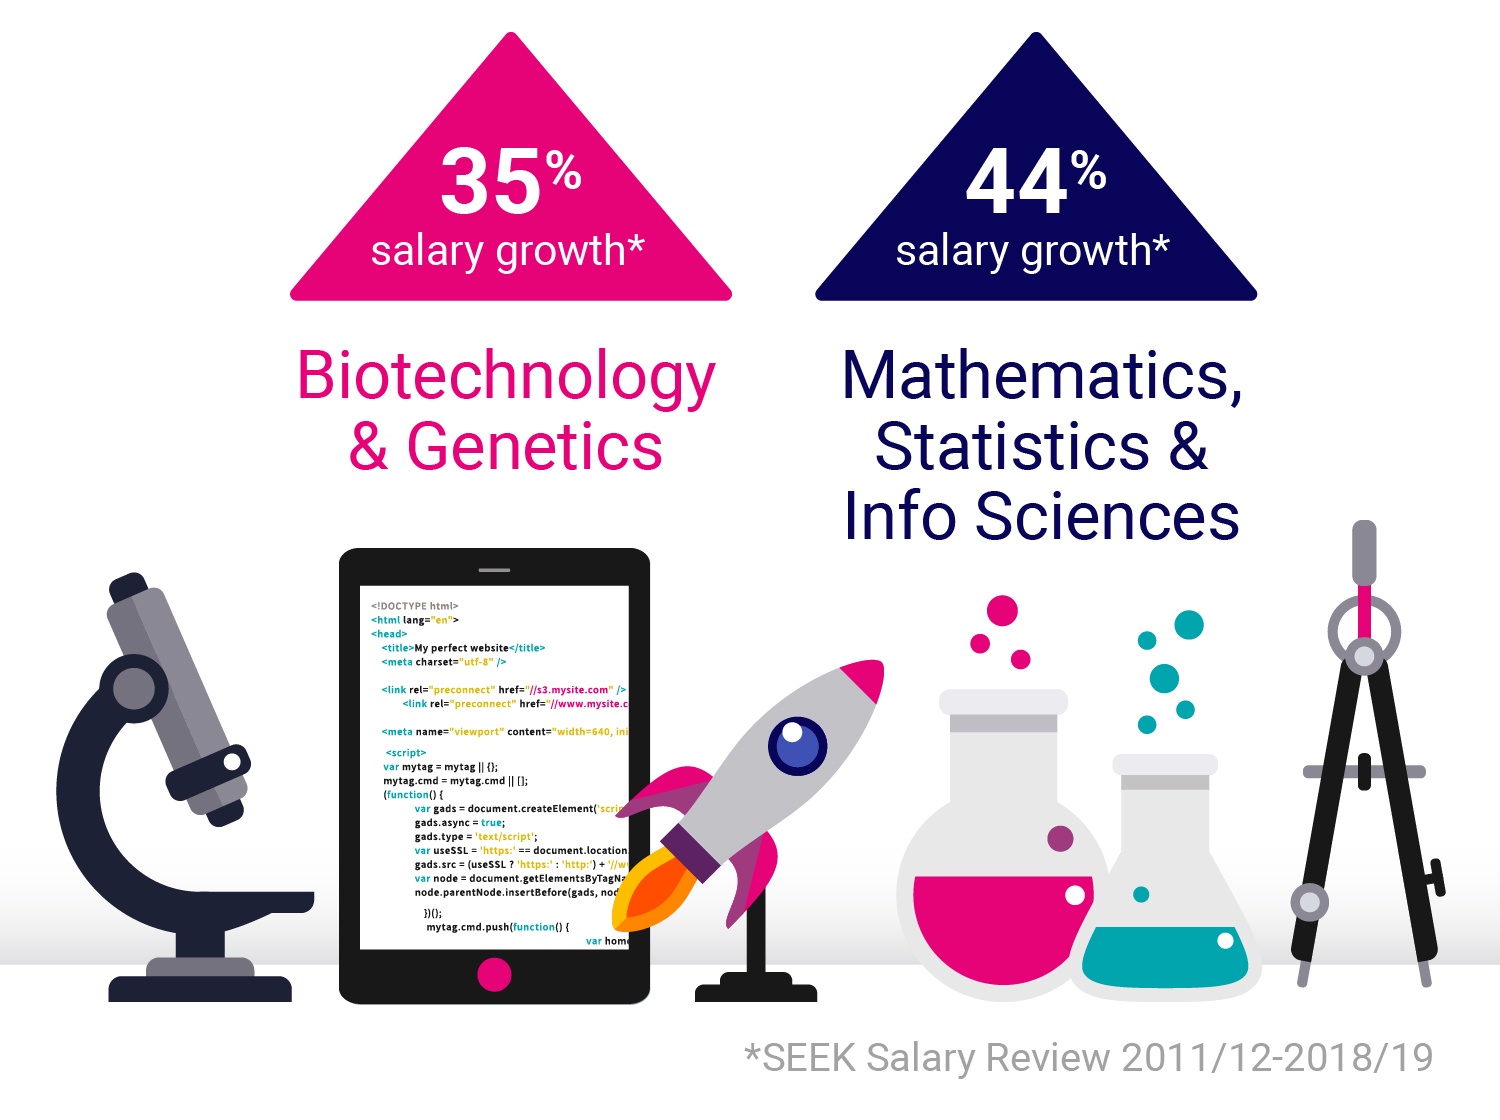
It’s little wonder that careers in science, technology, engineering and mathematics, or STEM, take up three of the top 20 places. Technology is playing an increasingly important role in both the economy and everyday life. Yet, despite heavy government promotion, between 2008 and 2018 the proportion of people studying these subjects fell. The consequent skills shortage can’t be resolved overnight, and is more likely to intensify, so it seems the value of qualified professionals in STEM will only continue to increase.
Australia's top 20 salary gains
| RANK
|
INDUSTRY
|
ROLE TYPE
|
2018-2019
|
%
|
|---|---|---|---|---|
| 1 | Insurance & Superannuation | Superannuation | $98,796 | 46% |
| 2 | Science & Technology | Mathematics, Statistics & Information Sciences | $118,937 | 44% |
| 3 | Education & Training | Teaching Aides & Special Needs | $66,907 | 43% |
| 4 | Design & Architecture | Web & Interaction Design | $103,321 | 38% |
| 5 | Education & Training | Teaching - Primary | $84,521 | 36% |
| 6 | Science & Technology | Biotechnology & Genetics | $92,466 | 35% |
| 7 | Community Services & Development | Aged & Disability Support | $71,545 | 32% |
| 8 | Farming, Animals & Conservation | Horticulture | $68,522 | 30% |
| 9 | Trades & Services | Carpentry & Cabinet Making | $68,076 | 29% |
| 10 | Education & Training | Teaching - Secondary | $87,934 | 29% |
| 11 | Community Services & Development | Volunteer Coordination & Support | $71,644 | 29% |
| 12 | Hospitality & Tourism | Gaming | $65,485 | 29% |
| 13 | Design & Architecture | Landscape Architecture | $90,172 | 28% |
| 14 | Community Services & Development | Child Welfare, Youth & Family Services | $77,702 | 28% |
| 15 | Trades & Services | Hair & Beauty Services | $52,102 | 28% |
| 16 | Manufacturing, Transport & Logistics | Public Transport & Taxi Services | $74,253 | 26% |
| 17 | Real Estate & Property | Valuation | $98,662 | 26% |
| 18 | Healthcare & Medical | Nursing - High Acuity | $82,754 | 26% |
| 19 | Information & Communication Technology | Engineering - Software | $116,547 | 26% |
| 20 | Education & Training | Childcare & Outside School Hours Care | $61,273 | 26% |
Source: SEEK Salary Review, annual full-time salary averages by role type, 2011/12-2018/19, SEEK.
Three forces shaping downward moves
Mighty mining digging itself out of a hole
At the peak of the mining construction boom, eager workers were lured to far-flung corners of Australia to earn salaries beyond their wildest dreams – examples abounded of truck drivers on mining sites earning over $150,000 a year. As the projects concluded, however, salaries fell. The result? Mining, Resources & Energy claimed a dispiriting nine of the 20 lowest places on our list of salary movement. That said, given the inflated starting point, this is better interpreted as a correction rather than a fall. Rebounding commodity prices and the consequent return of salary growth in the industry suggest the future could be brighter, though the cyclical nature of mining means this is definitely an industry to keep your eye on.
Construction cops collateral damage
Construction growth was largely tied to the mining industry at the beginning of the 2010s. Then, as the boom ended, the industry picked up again, this time due to residential construction. This growth is now starting to slow – construction appeared three times in our list of the biggest falls – so the hope is that investment in public infrastructure will help to pick up the slack for the 1.1 million Australians employed directly by the industry.
Legal eagles have their wings clipped
Of the 350+ role types on SEEK, Legal Professionals who were Generalists in a Law Firm took the biggest salary plunge. Paul Rawlinson, Global Chair of law firm Baker McKenzie, has said that, while 30 years ago clients might pay millions to have thousands of documents manually reviewed, today much of that labour has been handed over to machines. That doesn’t necessarily mean lawyers are surplus to requirements – it’s more likely that spending less time on tedious manual tasks frees them up to be more productive, creative and efficient. It could also explain how Generalist Lawyers show the biggest fall in salary, of 21%. Rather than being less valuable, they could well be doing more specialised work.
Australia's 20 biggest salary falls
| RANK
|
INDUSTRY
|
ROLE TYPE
|
2018-2019
|
%
|
|---|---|---|---|---|
| 1 | Legal | Generalists- Law Firm | $82,044 | -21% |
| 2 | Construction | Planning & Scheduling | $100,052 | -18% |
| 3 | Engineering | Materials Handling Engineering | $103,453 | -17% |
| 4 | Engineering | Mechanical Engineering | $97,633 | -16% |
| 5 | Mining, Resources & Energy | Oil & Gas - Drilling | $107,045 | -16% |
| 6 | Engineering | Process Engineering | $109,532 | -14% |
| 7 | Mining, Resources & Energy | Mining - Exploration & Geoscience | $120,461 | -13% |
| 8 | Accounting | Insolvency & Corporate recovery | $78,093 | -13% |
| 9 | Mining, Resources & Energy | Oil & Gas - Exploration & Geoscience | $120,961 | -12% |
| 10 | Construction | Quality Assurance & Control | $102,594 | -11% |
| 11 | Real Estate & Property | Residential Sales | $69,658 | -9% |
| 12 | Consulting & Strategy | Environmental & Sustainability | $96,251 | -9% |
| 13 | Mining, Resources & Energy | Mining - Operations | $123,688 | -9% |
| 14 | Mining, Resources & Energy | Oil & Gas – Production & Refinement | $115,677 | -9% |
| 15 | Mining, Resources & Energy | Mining – Engineering & Maintenance | $129,094 | -8% |
| 16 | Science & Technology | Environmental, Earth & Geosciences | $97,142 | -8% |
| 17 | Mining, Resources & Energy | Mining - Processing | $119,888 | -8% |
| 18 | Mining, Resources & Energy | Surveying | $122,229 | -7% |
| 19 | Mining, Resources & Energy | Oil & Gas – Operations | $113,314 | -7% |
| 20 | Construction | Health, Safety & Environment | $113,308 | -7% |
Source: SEEK Salary Review, annual full-time salary averages by role type, 2011/12-2018/19, SEEK.